Advanced Big Data Analysis: Transforming Complex Datasets into Strategic Business Advantages
Rahul Rastogi
Jun 24, 2025
What is Big Data Analysis?
Close to 402.74 million terabytes of data are generated daily, and the number is only growing! With so much data to handle, how do businesses manage it? Well, this is where big data analysis comes into play.
Simply put, it examines and analyzes large datasets to uncover trends, patterns, and insights, enabling you to make informed decisions, boost operational efficiency, and stay ahead of competitors.
Have you ever wondered how Netflix recommends your next favorite show? Well, that is big data analysis in action! This blog will discuss everything you need to know about the same and help you improve business outcomes.
How Big Data Analysis Works?
Let’s understand how you can analyze big data.
- Data Collection: You must collect structured and unstructured data from multiple sources. Doing so will boost reliability and give you a clear picture.
- Storing the Data: After that, you need to store the data in scalable databases. You must choose storage options carefully, as the volume and variety will change with time. Cloud storage options will help you select the correct tiers.
- Data Processing: The third and most crucial step is to clear and organize the data for analysis. Not doing so only increases storage costs and requires extra short—and long-term efforts.
- Data Analysis and Decision-Making: Using AI, ML, and visualization techniques, you can uncover insights that improve customer experiences and thus business growth.
The 5 V’s of Big Data Analysis
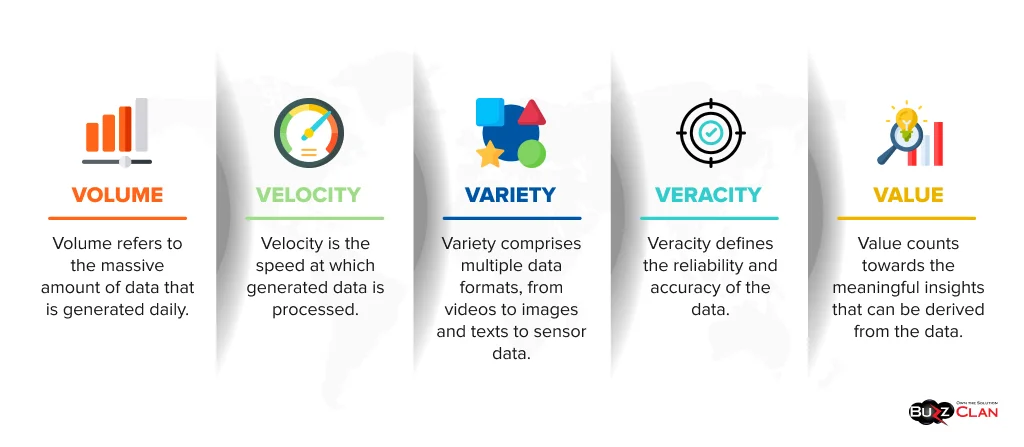
Big Data thrives in the tech world all due to 5 V’s. Let’s have a look at each of them.

- Volume refers to the massive amount of data that is generated daily.
- Velocity is the speed at which generated data is processed.
- Variety comprises multiple data formats, from videos to images and texts to sensor data.
- Veracity defines the reliability and accuracy of the data.
- Value counts towards the meaningful insights that can be derived from the data.
Data Analysis Methods
- Descriptive Analysis: This method helps you convert raw data into actionable insights. E-commerce companies often calculate average monthly sales using descriptive analysis to understand overall performance.
- Inferential Analysis: comes in handy when analyzing a larger sample using statistical methods. Such analyses are used in political surveys, where 1000 people are surveyed to predict the nation’s voting trend.
- Diagnostic Analysis: Such analysis comes in handy when identifying the root cause of a past outcome based on relationships and pattern analysis. You can easily understand why sales dropped or increased by analyzing customer behavior.
- Predictive Analysis: This method uses historical data and statistical models to forecast future trends. Banks use predictive analysis to determine which customers can default on loans based on their financial history.
- Prescriptive Analysis: This method suggests the best course of action based on insights. An example would be a cab app that surges prices based on demand during peak hours.
- Exploratory Data Analysis (EDA): This method uses summaries and visualizations to detect anomalies, trends, and patterns.
- Cohort Analysis: It divides users into groups based on shared characteristics and analyzes their behavior over time. Fitness app trackers analyze the users who joined at the quarter’s start and are still active.
- Regression Analysis: This method analyzes relationships between different variables to make predictions. It can be used to predict how advertising impacts sales.
Types of Big Data
Big data is put into three categories.
- Structured Data: The data is stored in a pre-defined format for easy access and analysis. These include databases and spreadsheets.
- Unstructured Data: Such data lacks a fixed format and needs advanced processing techniques.
- Semi-Structured Data: It has elements of both structured and unstructured data.
15 Essential Visual Big Data Analysis Techniques
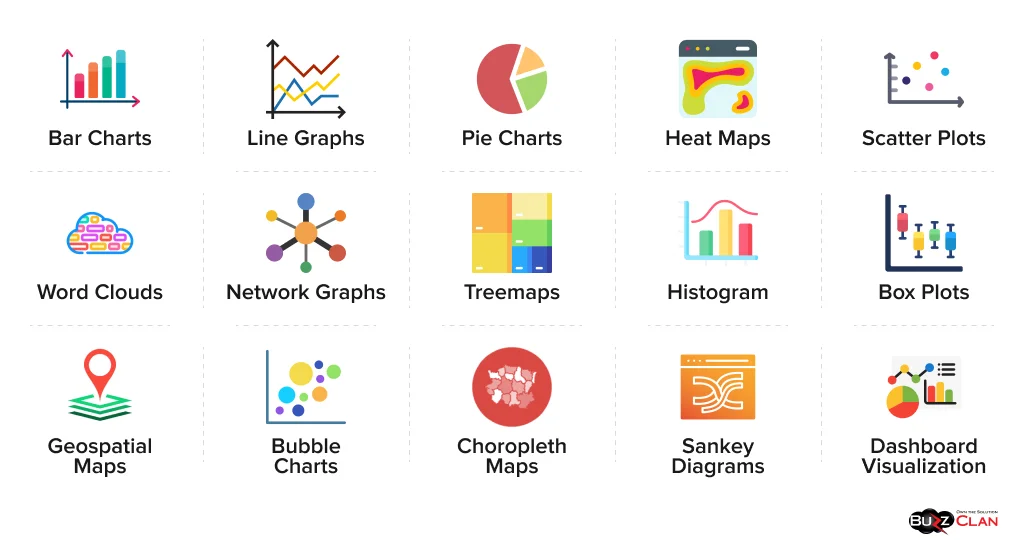
Let’s look at the top 15 techniques used for big data analysis.

- Bar Charts: Rectangular bars compare different groups and categories. Companies often use bar charts to compare annual revenue across five years or a decade.
- Line Graphs: They help you see trends over time and connect data points with a line. Weather stations use them to track daily temperature changes over a defined period.
- Pie Charts: These charts represent proportions of a whole using slices of a circle.
- Heat Maps: Data values are differentiated using varying color intensities in a matrix. Websites track user clicks by highlighting frequently visited sections in red.
- Scatter Plots: They display relations between two variables with individual data points. Scientists often analyze how weight and height are correlated among adults.
- Word Clouds: They help you visualize word frequency by displaying the most used words in varying sizes. Social media platforms generate word clouds from the trending hashtags.
- Network Graphs: They are ideal for establishing connections between nodes and lines.
- Treemaps: Nested rectangles represent hierarchical data. Businesses use treemaps to assess and visualize revenue breakdowns across different product categories.
- Histogram: They group numerical data into bins to display the frequency distribution. Teachers use it to analyze test scores to see how many students fall in a particular grade range.
- Box Plots summarize data distribution using medians, outliers, and quartiles. Hospitals use this analysis technique to compare patient times across departments.
- Geospatial Maps represent data on a map to analyze location-based trends. An example is a ride-sharing app that shows real-time vehicle availability across a city.
- Bubble Charts: Similar to scatter plots, bubble charts use variable-sized bubbles to represent a third dimension. Businesses use them to compare sales, store size, and profit.
- Choropleth Maps: Color gradients represent data intensity across regions. These maps visualize unemployment rates across different rates.
- Sankey Diagrams: Best used to show the flow of data, energy, or resources between categories. Websites use this technique to display user navigation from the homepage to checkout.
- Dashboard Visualization combines multiple visual elements into an interactive interface for real-time insights. It is used to track the company’s overall progress in one view.
Benefits of Big Data Analysis
Let’s have a look at how big data analysis benefits your business.
- When you know all the patterns and trends, you can recommend better products to customers, tailor your recommendations, and thus expect improved sales and revenue.
- Big data analysis will help you better detect anomalies and flag suspicious activities.
- By analyzing the efficiency of your processes, you can be proactive with inventory and better serve customers.
- You can predict equipment failures before they occur, just like General Electric uses sensors to schedule maintenance activities and reduce downtime.
- It will help you identify health risks, enable prevention, and thus promote well-being.
- Bank of America uses data analytics to predict and mitigate risks by examining customers’ financial histories.
Further Reading
Differences between Big Data and Traditional Data
Let’s understand the parameters that differentiate big and traditional data.
| Big Data | Traditional Data |
|---|---|
| Big data consists of large and complex datasets that cannot be processed using traditional data management tools. | Can easily be managed using conventional database management systems. |
| The average size is terabytes or petabytes. | Data size is measured in gigabytes, or at the max, terabytes. |
| A mix of unstructured, structured, and semi-structured data. | Traditional data primarily consists of structured and relational data. |
| Data processing happens in real or near real-time. | Batch processing is done. |
| Highly scalable with distributed computing systems. | Limited scalability with vertical scaling. |
| Higher tolerance due to distributed architecture. | Lesser fault tolerance as hardware failure can lead to data loss. |
Key Challenges in Big Data Analysis
Big data analysis is not free of challenges. Here are a few things you need to deal with.
- Handling large data volumes leads to storage and processing issues. The best solution is to use scalable cloud storage options and distributed frameworks like Hadoop (trusted by Netflix, too!) to facilitate efficient processing.
- Multiple data formats complicate integration. Luckily, data lake solutions can help you streamline diverse data handling. The need for instant processing arises from the influx of real-time data from sensors and devices. For the same, you need to use tools that can help keep up with the speed.
- Securing sensitive information is challenging given the rising cyber threats and breaches. To navigate these issues, follow cybersecurity best practices.
- Managing peak performance with growth is seldom easy. Scaling will help you better manage loads and processes during peak traffic times.
- Storing and processing vast amounts of data is costly. Thus, you must invest in cost-effective cloud plans to handle data affordably.
- Big data analysis requires niche technical skills; you must invest in training programs for your team to develop them.
- Old systems struggle to integrate with big data solutions. The solution is to use high-quality APIs and middleware.
- Cyber threats continue to be a menace. Best practices like end-to-end encryption, monitoring and logging, and automated compliance will help you safeguard your data.
How Visualization Helps Overcome Big Data Challenges?
As it is said, pictures are worth a thousand words. Here is how visualization helps you sail through all big data challenges.
- You can easily convert large datasets into easy-to-understand charts or graphs, revealing patterns that are usually hard to spot in raw data. Plus, it allows you to make decisions quicker and with enhanced accuracy.
- Visualization tools will help you detect unusual dataset behavior, make complex data more accessible, and allow users to uncover deeper insights while enjoying simplicity.
Best Tools for Big Data Analysis in 2025
Here are some tools that will help you analyze with enhanced ease.
| Tool | Category | Key Features | Best For |
|---|---|---|---|
| Apache Spark | Distributed Processing | In-memory computing, real-time analytics | Large-scale data processing |
| Hadoop (HDFS & MapReduce) | Distributed Storage & Processing | Scalable, cost-effective, batch processing | Handling massive datasets |
| Google BigQuery | Cloud Data Warehouse | Serverless, real-time insights, SQL-based | Cloud-based analytics |
| Amazon Redshift | Cloud Data Warehouse | Fast querying, scalable, SQL-based | Cloud data warehousing |
| Snowflake | Cloud Data Platform | Multi-cloud support, automatic scaling | Data sharing and warehousing |
| Databricks | Unified Analytics Platform | Apache Spark-based ML integration | AI-driven analytics |
| Dask | Parallel Computing | Scales Python libraries, easy to use | Large-scale Python processing |
| Tableau | Data Visualization | Drag-and-drop UI, real-time dashboards | Business intelligence (BI) |
| Power BI | Business Analytics | Microsoft ecosystem integration, AI-driven insights | Enterprise reporting |
| Google Data Studio | Data Visualization | Free, cloud-based, easy reporting | Small to mid-size businesses |
| TensorFlow | Machine Learning | Deep learning, scalability | AI and predictive analytics |
| PyTorch | Machine Learning | Dynamic computation graph, easy debugging | AI and research analytics |
| RapidMiner | Data Science Platform | No-code ML, automated data prep | Data science automation |
| Alteryx | Self-service Data Analytics | No-code analytics, AI integration | Data preparation and blending |
| Apache Flink | Real-time Stream Processing | Low latency, event-driven computing | Real-time analytics |
The Role of Data Visualization in Big Data Analysis
Data visualization helps transform complex data into attractive and easy-to-understand visual formats. This allows for better insights and decisions. Imagine trying to make sense of data that bounces off your data. On the other hand, the analysis makes sense with heatmaps, charts, and graphs. Not only can it help you better identify trends and anomalies, but it can also get better sales metrics and boost user engagement. Analysts use tools like Power BI and Tableau for data storytelling so stakeholders can quickly act on the insights. When large volumes of big data make manual analysis impractical, visualization establishes simple communication.
How AI and Machine Learning Are Transforming Big Data Visualization?
AI and ML help you go beyond analysis by offering predictive insights and uncovering hidden patterns. Traditional visualization methods are adept at dealing with complex datasets. AI-powered tools suggest key metrics by generating charts. While some organizations use AI and ML to enhance their marketing efforts, entertainment giants like Netflix use it to improve content recommendations and raise customer satisfaction ratios.
How BuzzClan Can Help You Master Big Data Analysis?
With expert guidance, cutting-edge tools, and comprehensive training at your fingertips, our team of experts will help your team manage big data like a pro. We offer industry-specific solutions and cloud-based analytics to help you visualize and interpret complex data better. We are here if you wish to transform your operations, boost decision-making, or stay ahead of your competitors by leveraging big data.
Final Thoughts
Big data analysis is no longer a luxury but a necessity in the digital era. As data grows faster, having the right tools and techniques becomes a stepping stone to success. The need of the hour is to have a structured and transparent approach, stay updated with the latest trends, and rope in experts to help you unlock the full potential of your data and gain a solid edge.
FAQs

Get In Touch
Follow Us
Table of Contents
- What is Big Data Analysis?
- How Big Data Analysis Works?
- The 5 V’s of Big Data Analysis
- Data Analysis Methods
- Types of Big Data
- 15 Essential Visual Big Data Analysis Techniques
- Benefits of Big Data Analysis
- Differences between Big Data and Traditional Data
- Key Challenges in Big Data Analysis
- How Visualization Helps Overcome Big Data Challenges?
- Best Tools for Big Data Analysis in 2025
- The Role of Data Visualization in Big Data Analysis
- How AI and Machine Learning Are Transforming Big Data Visualization?
- How BuzzClan Can Help You Master Big Data Analysis?
- Final Thoughts
- FAQs
- Get In Touch
