Comprehensive Guide to APM Tools: Navigating Performance Management
Vishal Sharma
Nov 27, 2024
Introduction to APM Tools
Application performance management (APM) tools have become indispensable for businesses in the digital age. As companies increasingly rely on complex technology stacks to power their operations and services, APM tools provide visibility into the health and efficiency of these systems. With the right APM solution, organizations can proactively identify and troubleshoot performance bottlenecks, reduce Mean Time To Resolution (MTTR) for issues, and ensure optimal end-user experiences.
This comprehensive guide will explore the world of APM tools, their key capabilities, leading solutions in the market, and best practices for leveraging these technologies. Whether you want to implement APM for the first time or optimize existing systems, this guide will help you navigate the performance management space.
What are APM tools?
APM tools refer to software programs and platforms designed specifically for monitoring and optimizing application performance. They provide aggregated data, analytics, and insights about critical performance metrics, allowing IT teams to track behaviors, usage patterns, errors, response times, and more across an application ecosystem.
Core capabilities of APM solutions include:

- Application topology mapping and visualization
- User experience and performance monitoring
- Transaction tracing and root cause analysis
- Alerting based on defined thresholds
- Reporting and analytics features
Leading APM platforms leverage artificial intelligence and machine learning to detect anomalies, forecast issues, and optimize system health and efficiency.
The evolution of APM tools in the tech industry
The inception of APM tools dates back to the 1990s when applications became critical for business operations. Early solutions focused more on availability monitoring and uptime.
The need for more sophisticated APM capabilities also arose with the rapid evolution of application architecture from monoliths to distributed microservices and cloud-native structures. This led to a new generation of APM tools that provided deeper visibility into traces, logs, user behavior analytics, CI/CD integrations, and more.
APM is now an expansive market segmented into various capability tiers – from essential monitoring to advanced AI-driven platforms. Global Application Performance Management (APM) Market to Reach $18.8 Billion by 2030. With digital experience becoming an enterprise priority, investments in APM are poised to grow exponentially.
Key Components of APM Tools
While APM solutions can vary significantly in their capabilities, most modern tools have a core set of components:
- Monitoring and data collection engine: This engine collects performance metrics from different application components, servers, databases, networks, etc., and allows users to customize data collection parameters.
- Visual mapping and topology: Discovers application architecture and dependencies. Provides a visual map of the entire environment.
- Dashboards and reporting: Real-time and historical monitoring dashboards with KPI tracking. Ability to drill down to various metric levels.
- Alerting and notification system: This system allows teams to set performance thresholds and receive notifications about issues or anomalies. It integrates with communication channels like email, SMS, etc.
- User-experience monitoring: Simulates end-user journeys across services to measure real-world visibility. Provides segmentation like location, browser, etc.
- Transaction tracing: Follows the path of transactions/requests across a distributed architecture. It helps isolate the root cause of performance issues.
- Analytics and intelligence: Statistical analysis, forecasting, machine learning, and AI-driven insights for optimal performance.
How these components contribute to effective application performance management
The breadth of APM capabilities mutually reinforce each other to enable holistic monitoring and managed performance optimization.
Mapping application topology provides the foundation for accurately monitoring instruments across the correct components. Customized monitoring metrics feed into aggregated dashboards that act as a single pane of glass for observability.
Powerful analytics helps teams find correlations between events and uncover performance optimization opportunities. Combining real user experience data with transaction traces enables pinpointing of root causes.
Finally, the alerting, notification, and intelligence features facilitate predictive capabilities and proactive management of issues before they escalate and impact users.
APM Tools List and Analysis
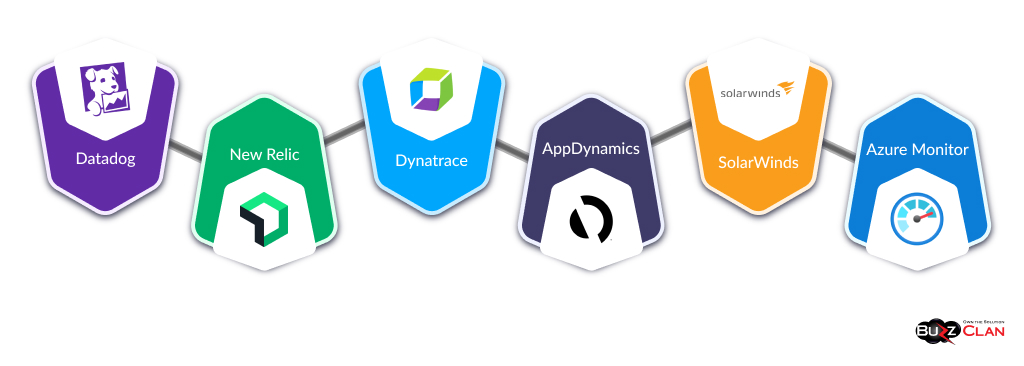
The application performance management space has a reasonable number of technology vendors. Here is a curated list of leading APM solutions:
- Datadog: A cloud-based monitoring and analytics platform for cloud infrastructure, applications, logs, and more. Provides out-of-the-box visibility with 400+ integrations.
- New Relic: End-to-end observability platform. Capabilities include instrumentation, dashboards, debugging tools, alerting, and AI-driven insights.
- Dynatrace: Full-stack monitoring solution. Strengths include smartscape topology, powered by Davis AI engine, and advanced transaction tracing.
- AppDynamics: Robust enterprise APM tool by Cisco. Excels at business transaction monitoring, distributed tracing, and analytics.
- SolarWinds: An on-premise APM solution offering application tracing, anomaly detection, and log analytics bundled together.
- Azure Monitor: Microsoft’s native APM offering seamlessly integrates with Azure infrastructure and provides holistic observability.
A brief analysis of each tool’s key features and capabilities
While all APM solutions offer standard core capabilities, they differ significantly regarding aspects like depth of metrics, data ingestion pipelines, analytics engines, ease of implementation and use, etc.
- Datadog stands out for its vast library of 350+ out-of-the-box integrations, allowing for flexible and unified data ingestion. It leverages global site monitoring to provide visibility for the external user experience. The platform provides powerful ad-hoc querying and visualization capabilities.
- New Relic has made significant investments in instrumentation for modern application architectures. Its NLX framework helps seamless data ingestion and leverages machine learning for incident prediction. The tool excels in UX monitoring and distributed tracing.
- Dynatrace is considered an industry leader with its Davis AI engine that automatically discovers topology and provides answers instead of just data. The solution offers code-level visibility and intelligent alerts. Its PurePath technology enables advanced transaction tracing.
- AppDynamics dominates the enterprise market with its business transaction monitoring, ability to prioritize issues using business metrics, and rapid time to value. It offers a seamless experience for distributed applications with very low overhead.
- SolarWinds provides flexibility by bundling its log monitoring, infrastructure monitoring, and APM capabilities. Its Orion platform gives IT visibility across hybrid environments, while Log Analyzer offers insights into application performance issues.
For Azure cloud customers, Azure Monitor offers native integration for application insights with automatic code instrumentation capability. Its distributed tracing feature provides end-to-end transaction views.
The Best APM Tools for Businesses
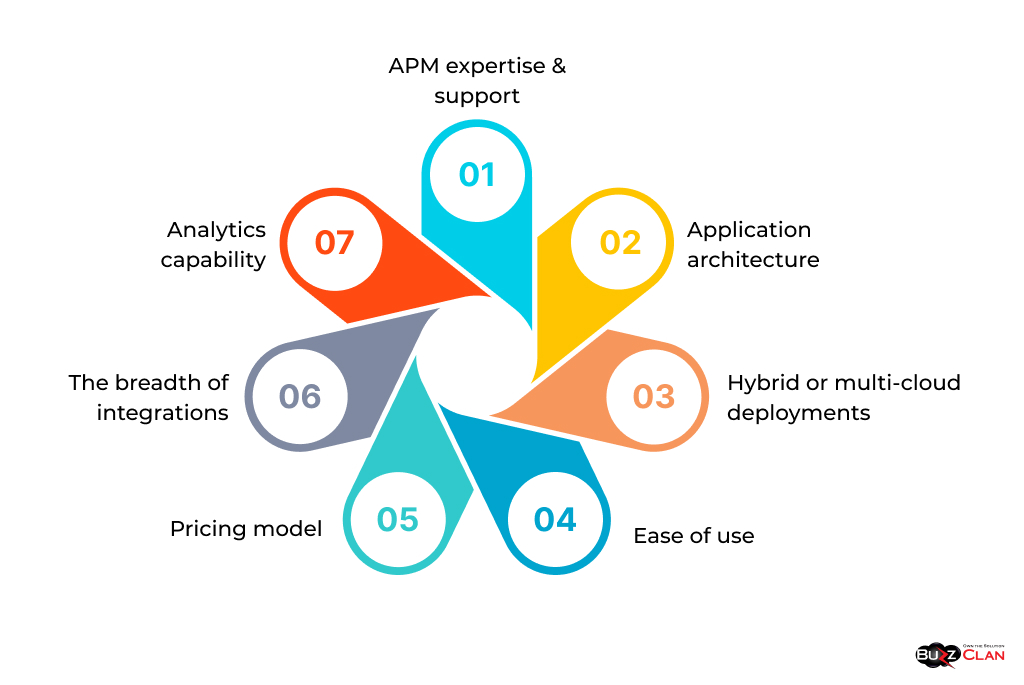
Criteria for selecting the best APM tools for different business needs
With the abundance of capable tools, identifying the ideal APM solution for your stack comes down to aligning with specific business requirements and use cases. Some key selection criteria include:
- Application architecture: The solution must offer comprehensive visibility aligned to existing infrastructure, such as microservices, serverless, containers, etc.
- Hybrid or multi-cloud deployments: For complex environments, tools that provide unified observability across data centers, public cloud, and containers.
- Analytics capability: Intelligent forecasting, anomaly detection, and querying abilities allow proactive performance management.
- The breadth of integrations: More out-of-the-box integrations mean faster deployments and a single pane of glass visibility.
- Pricing model: Support for open-source software, ability to start small and scale, and pay-as-you-go models offer better Total Cost of Ownership (TCO).
- Ease of use: Intuitive interfaces and well-designed workflows directly affect user adoption across teams, including the ability to customize views for different roles.
- APM expertise & support: For enterprise-grade implementations, partner with vendors that provide smooth deployments, training, support, etc.
APM Monitoring Tools Explained
APM monitoring tools refer to application components that collect performance data, trace errors to their origin, and transmit information to databases and analytics systems in real-time. This is the foundation for application performance monitoring, management, and optimization.
Popular methods for application performance monitoring include:
- Code instrumentation: Libraries like OpenTracing and OpenTelemetry automatically instrument application code to extract distributed traces and other signals. Agents monitor these to obtain code-level visibility without overhead.
- Real user monitoring (RUM): Browser agents monitor user interactions with the application by capturing metrics like page load times, AJAX calls, errors, etc. Provides proper visibility into the customer experience.
- Synthetic monitoring: Simulates user journeys via automated bots and alerts teams on potential issues before they impact customers. Beneficial for stress testing and establishing performance baselines.
- Log monitoring: Harvesting application logs and analyzing them via ML algorithms provides visibility into warning signs of performance issues.
Comparison of various monitoring tools and their effectiveness
APM monitoring tools can be compared across dimensions like supported languages and frameworks, overhead costs, data sampling frequency, ability to connect traces, etc.
For example, OpenTelemetry provides vendor-agnostic instrumentation libraries that support popular languages like Python, Javascript, Java, etc. Solutions like Datadog and Dynatrace have custom instrumentation baked into Agents for framing metrics and traces.
Similarly, host-based tools like AppDynamics only claim a negligible overhead of 2-3%. SaaS solutions may sample signals at varied frequencies to minimize costs.
Overall, it is ideal to leverage a combination of APM monitoring approaches like code instrumentation, user analytics, and logging for comprehensive visibility. Enterprise tools like Dynatrace offer the entire package.
Advantages of open-source APM tools
While commercial solutions offer enterprise-grade capabilities, open-source APM tools have their unique benefits:
- Cost: Avoid expensive licensing models and take advantage of freely available tools. Flexible to scale up and down.
- Customizability: Ability to tweak open-source tools to meet specific instrumentation and monitoring needs across architectures.
- No vendor lock-ins: Mix-and-match solutions instead of being locked into a single vendor, especially for large enterprises.
- Innovation: Open source projects foster faster innovation cycles through public contributions compared to proprietary software.
Top open-source APM tools available in the market
- Prometheus: A popular time-series monitoring toolkit that scrapes metrics from applications with an efficient data store. Easy to deploy on Kubernetes.
- Grafana: Open source analytics and visualization frontend that integrates seamlessly with data sources like Prometheus, Graphite, etc., for powerful dashboards.
- Jaeger: Distributed tracing platform with support for popular languages and Open Telemetry integration. Backed by Cloud Native Computing Foundation (CNCF).
- Zipkin: Another end-to-end distributed tracing system optimized for microservices architectures on platforms like Kubernetes and originated at Twitter.
- Elastic: While not a pure-play APM, the Elastic Stack offers log monitoring, application performance monitoring, infrastructure metrics, and anomaly detection, making it a compelling open-source option.
Comprehensive APM Tools Comparison
Evaluating APM tools head-to-head can be challenging, given the breadth of their capabilities. This section provides a comparative analysis of leading solutions:
Comparative analysis of leading APM tools based on features, pricing, and user feedback
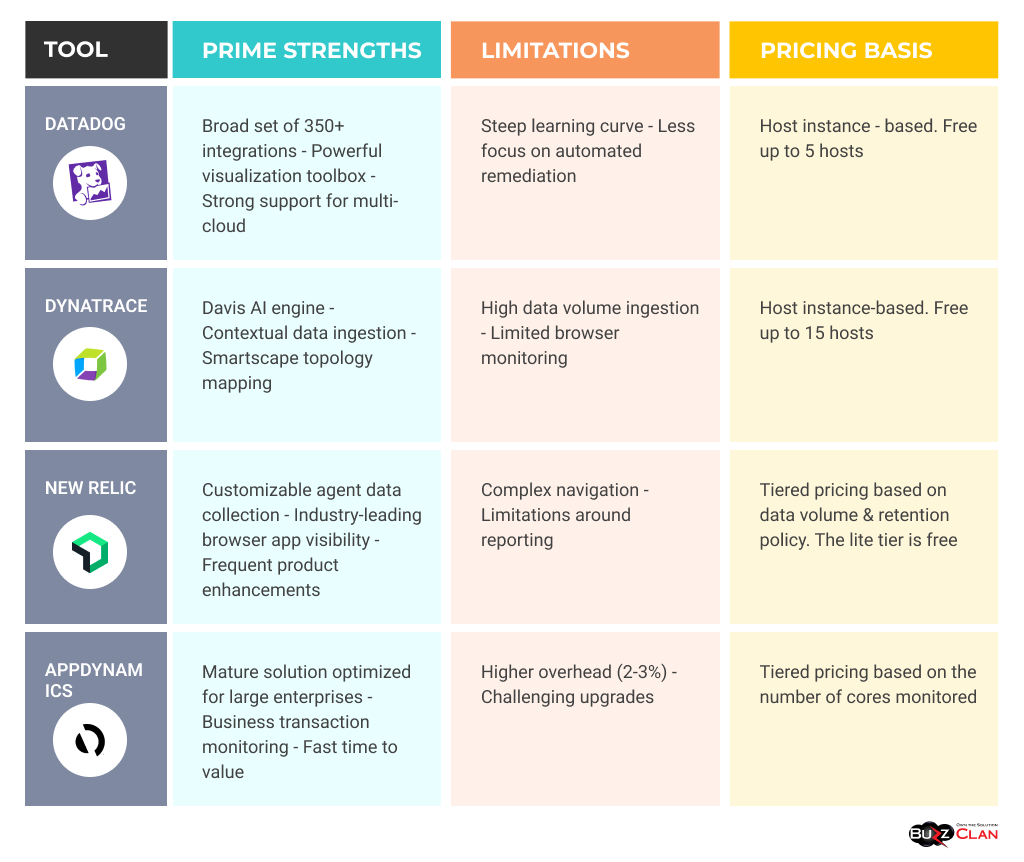
Understanding the strengths and weaknesses of different APM tools
In summary – Datadog leads in data ingestion flexibility but has a learning curve in mining insights. Dynatrace excels in automated intelligence, but costs spike with scale.
New Relic bridges integration and analytics well at scale but needs UI improvement. AppDynamics offers premium enterprise capabilities, but upgrades can be painful.
The choice ultimately depends on your application environment, team skills, and scaling ambitions. Building an evaluation scorecard around these parameters is advisable before zeroing in on an APM platform.
APM Tools in the Gartner Magic Quadrant
Gartner Magic Quadrant (MQ) provides a valuable market perspective by categorizing vendors into four categories – Leaders, Visionaries, Niche Players, and Challengers. The report features the following APM solutions:
Leaders Quadrant
- Dynatrace: Placed highest for completeness of vision and ability to execute. Praised for innovation in intelligence analytics, ease of use, and flow metrics.
- Datadog: Offers a comprehensive monitoring solution integrating infrastructure, applications, and logs with strong reporting and analytics.
- New Relic: Demonstrates ability to support evolving customer needs with investments in telemetry data platform (TDP) and AI Ops capabilities.
Visionaries Quadrant
- Honeycomb: Focuses on modern observability with deep debugging capabilities tailored for distributed systems.
- Elastic (Elasticsearch): Well-regarded for its scalability and search-focused analytics in APM and observability.
Niche Players Quadrant
- AppDynamics (Cisco): Prioritizes business transaction monitoring and operational insights but has limited flexibility compared to others in the Leaders Quadrant.
- Instana (IBM): Specializes in application performance optimization for complex environments, though it may not cover all APM needs comprehensively.
Insights into Gartner’s assessment and market trends
Gartner highlights exciting innovations around areas like applied AI to improve mean time to detection and resolution for performance issues.
Vendors are focused on converged observability platforms that deliver an interconnected set of monitoring capabilities beyond APM – including infrastructure, logs, digital experience, etc.
Key trends to watch include:
- Evolution of Value Stream Management Platforms
- Integration of security monitoring into observability
- Broader adoption of AI Ops and MLOps
APM Tools for Specific Needs
Organizations often utilize a mix of products to obtain full-stack observability. This section explores specialized APM solutions for specific environments:
- .NET Frameworks: .NET customers gain advantages by using Dynatrace’s Davis AIOps engine to smartly baseline, segment, and analyze transaction behavior for issues. New Relic dominates here with a .NET agent tying into a broader platform.
- APM Automation Tools: Site24x7 offers an automated APM solution that discovers applications, maps dependencies, and sets thresholds and alerts without requiring manual configuration. BigPanda auto-correlates cross-domain IT signals using AIOps.
- APM Testing Tools: Catchpoint provides web monitoring and testing from outside in via global vantage points. Loader.io specializes in load-testing tools optimized for modern applications. BlazeMeter enables performance testing of microservices, APIs, and web apps.
Decoding the Future of APM Tools
As cloud-native applications and distributed architectures become ubiquitous, APM’s role in delivering flawless digital experiences takes center stage. Gartner predicts global spending on APM will reach $11 billion by 2025.
Predictions and upcoming trends in the APM tools market
Here are the key trends set to define the future of APM space:
- Convergence of monitoring capabilities into unified observability platforms
- Mainstreaming of applied intelligence and AIOps across APM workflows – reducing reliance on rules and thresholds to drive action.
- Integration of security insights with performance monitoring data
- Increased focus on optimizing engineering productivity and business outcomes beyond infrastructure health
- Growth of Value Stream Management platforms tying business KPIs with software delivery performance
- Rise of Observability-as-a-Service (ObserVaaS) for accelerated implementations
The evolving landscape of application performance management
As cloud engineering models transform application infrastructure to be ephemeral, complex, and distributed, APM must evolve from just monitoring to becoming the source of truth for continuously optimizing iterative development.
Vendors are coming to market with innovative capabilities related to auto-instrumentation, applied ML, API-first ingestion pipelines, and unified data lakes, catering to various personas across developers, SREs, and businesses.
Free and Paid APM Tools: Making the Right Choice
Free APM tools offer a subset of capabilities available in paid versions. A comparison between free and paid APM tools
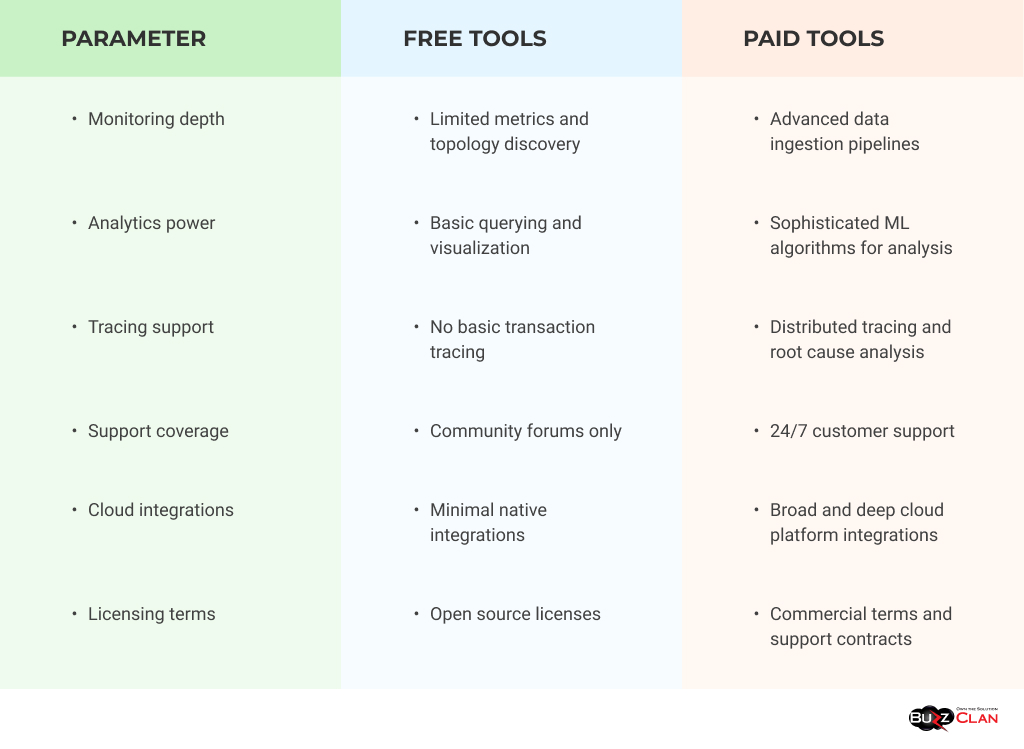
Situations where free APM tools can be sufficient and when paid tools are necessary
For personal projects, early-stage startups, or smaller applications – open-source and free offerings provide enough observability into infrastructure health, primary traces, and logs. Solutions like Grafana offer added flexibility.
However, as engineering complexity and business scales – the need for depth in metrics, the ability to connect signals across domains, advanced troubleshooting capabilities, and 24×7 expert support outweigh the sticker price of paid tools.
Leading APM vendors like Datadog and New Relic specialize in catering to these enterprise-grade use cases with specialized support models.
Optimizing Business Performance with APM Tools
In an increasingly software-defined world, delivering flawless digital experiences has become table stakes for sustaining competitive advantage. Consumer loyalty and brand reputation significantly affect applications’ availability, responsiveness, and reliability.
This is where APM plays a fundamental role – it acts as the radar revealing positional weaknesses that require fortification. Leading organizations leverage APM insights to establish baselines, uncover optimization areas, and tie technology KPIs back to business success metrics.
Over time, maturing APM posture helps technology teams progress from reactive firefighting to proactive performance vigilance through applied intelligence.
Conclusion
For SMBs and startups, begin by instrumenting beyond the infrastructure layer into application visibility via open-source agents or programmatic frameworks like OpenTelemetry. Then, double down on logs and basic tracing.
Mid-size digital native firms must invest in more powerful analytics, establish developer-centric workflows leveraging APM, and focus on customer-impacting problems.
Lastly, large enterprises implementing complex digital transformations require managing scale, diversity, and culture simultaneously – necessitating converged observability platforms like Dynatrace, Datadog, etc., built around AIOps capabilities to enhance automation and productivity.
APM adoption necessitates updated mindsets and processes beyond tools. But done right, it forms the nutraceutical, promising healthier, faster, and more intelligent applications—ultimately translating to delighted customers and prosperous businesses!
FAQs

Get In Touch
Follow Us
Table of Contents
- Introduction to APM Tools
- What are APM tools?
- Key Components of APM Tools
- APM Tools List and Analysis
- The Best APM Tools for Businesses
- APM Monitoring Tools Explained
- Advantages of open-source APM tools
- Comprehensive APM Tools Comparison
- APM Tools in the Gartner Magic Quadrant
- APM Tools for Specific Needs
- Decoding the Future of APM Tools
- Free and Paid APM Tools: Making the Right Choice
- Optimizing Business Performance with APM Tools
- Conclusion
- FAQs

