The Ultimate Guide to Application Performance Monitoring (APM)
Anjali Agrawal
Jun 7, 2024
Introduction
In today’s fast-paced digital landscape, ensuring optimal application performance is crucial for businesses to maintain a competitive edge and deliver seamless user experiences. Application Performance Monitoring (APM) has emerged as a critical practice that empowers organizations to proactively monitor, identify, and resolve performance issues before they impact end-users. As the complexity of software applications continues to grow, the need for effective APM solutions has become more pressing than ever.
This comprehensive blog post will dive deep into Application Performance Monitoring, providing an in-depth understanding of APM, its key components, and its benefits to modern software development and maintenance. We will explore the various types of APM, popular tools in the market, and the crucial metrics to track for ensuring optimal application performance. Additionally, we will present real-world case studies showcasing successful APM implementations and discuss the future trends shaping the APM landscape. By the end of this post, you will have a solid grasp of APM and be well-equipped to leverage its power in your organization.
What is Application Performance Monitoring?
Application Performance Monitoring (APM) is the practice of monitoring and managing software applications’ performance and availability. It involves continuously collecting, analyzing, and visualizing application performance data to identify and diagnose performance issues, optimize resource utilization, and ensure a seamless user experience. APM tools provide real-time insights into application behavior, enabling development and operations teams to detect and resolve performance bottlenecks before they proactively impact end-users.
The primary goals of APM are to:
- Ensure application availability and reliability
- Optimize application performance and response times
- Identify and diagnose performance issues quickly
- Improve user satisfaction and retention
- Reduce downtime and minimize business impact
In today’s highly competitive digital landscape, poor application performance can lead to frustrated users, lost revenue, and damaged brand reputation. APM empowers organizations to proactively monitor and optimize application performance, ensuring a smooth and responsive user experience across various devices and platforms.
Key Components of Application Performance Monitoring
Effective Application Performance Monitoring involves several key components that provide comprehensive visibility into application behavior and performance. These components include:

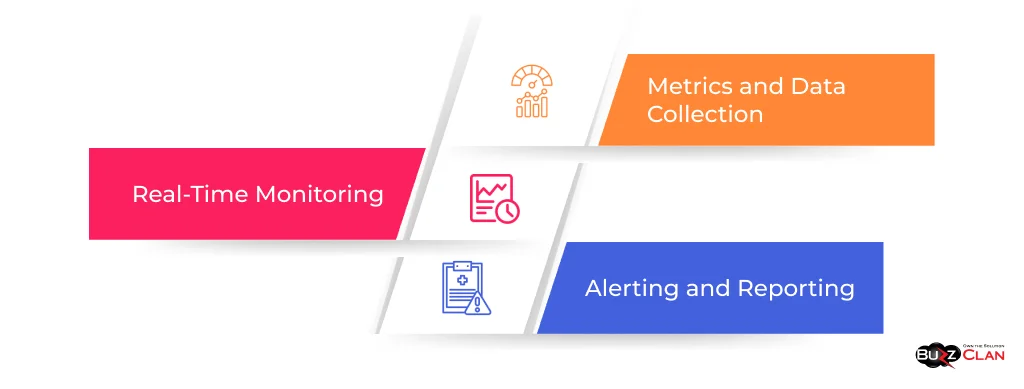
Metrics and Data Collection:
APM tools collect performance metrics from various sources, including application logs, server metrics, network data, and user interactions. Some key metrics tracked in APM include response time, throughput, error rates, CPU usage, memory consumption, and database queries. By collecting and analyzing these metrics, APM tools provide valuable insights into application performance and help identify potential bottlenecks.
Real-Time Monitoring:
Real-time monitoring is a critical aspect of APM, enabling teams to detect and respond to performance issues as they occur instantly. APM tools provide live dashboards and visualizations that display real-time application performance data, allowing teams to quickly identify and investigate any anomalies or degradation in performance. Real-time monitoring helps minimize downtime and ensures that applications are always available and responsive to end-users.
Alerting and Reporting:
APM tools generate alerts and notifications when application performance deviates from predefined thresholds or when critical issues are detected. These alerts can be customized based on specific metrics, severity levels, and business impact, ensuring that the right people are notified at the right time. APM tools also provide detailed reports and analytics, enabling teams to track performance trends over time, identify patterns, and make data-driven decisions for performance optimization.
Types of Application Performance Monitoring
Application Performance Monitoring covers various aspects of application performance, including web applications, infrastructure, and databases. Let’s explore each type in more detail:
Web Application Performance Monitoring:
Web Application Performance Monitoring focuses on monitoring the performance and availability of web-based applications. It tracks key metrics such as page load times, response times, and error rates, providing insights into how users interact with the application. Web APM tools also monitor the performance of individual transactions, such as login requests or checkout processes, helping identify bottlenecks and optimize user journeys.
Infrastructure Monitoring:
Infrastructure Monitoring involves monitoring the underlying hardware and software components that support the application, such as servers, networks, and operating systems. APM tools collect metrics on CPU usage, memory consumption, disk I/O, and network bandwidth, helping teams ensure that the infrastructure performs optimally and can handle the application’s workload. Infrastructure Monitoring helps identify capacity issues, detect anomalies, and optimize resource allocation.
Database Monitoring:
Database Monitoring focuses on monitoring the performance and health of databases that support the application. APM tools track metrics such as query response times, database connections, and resource utilization, helping identify slow queries, optimize database performance, and prevent database-related issues from impacting application performance. Database Monitoring also helps ensure data integrity and security, detecting unauthorized access or potential breaches.
Popular Application Performance Monitoring Tools
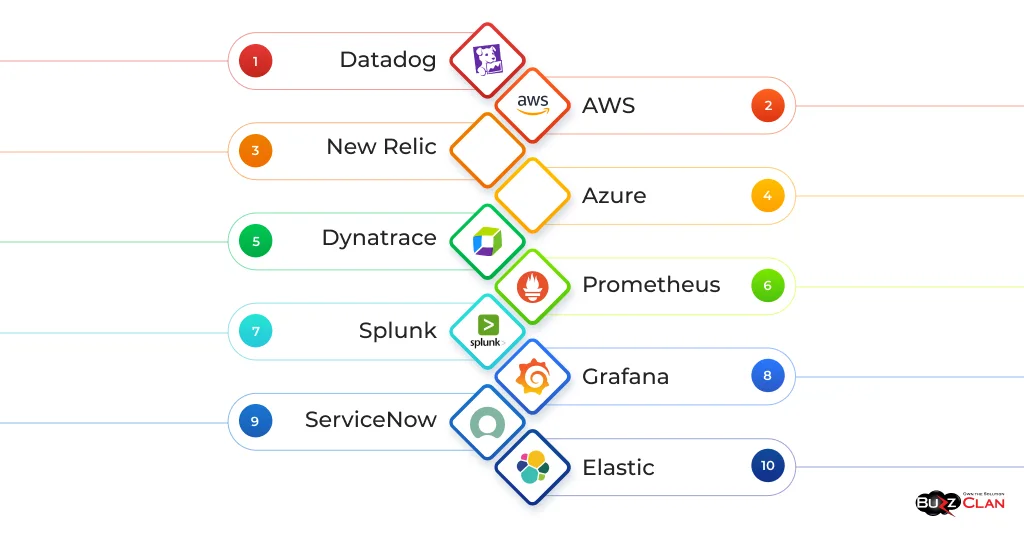
A wide range of application performance monitoring tools are available on the market, each with unique features and capabilities. Here’s an overview of some of the most popular APM tools:

Datadog:
Datadog is a comprehensive monitoring and analytics platform that provides end-to-end visibility into application performance. It offers real-time metrics, distributed tracing, log management, and user experience monitoring features. Datadog integrates with various technologies and provides customizable dashboards and alerts for proactive performance management.
New Relic:
New Relic is a powerful APM tool that offers full-stack visibility into application performance. It provides real-time monitoring, transaction tracing, and code-level diagnostics, enabling teams to identify and resolve performance issues quickly. New Relic also offers browser, mobile, and serverless monitoring, making it suitable for modern application architectures.
Dynatrace:
Dynatrace is an AI-powered APM platform that provides intelligent observability and automation capabilities. It offers automatic discovery and instrumentation features, real-time topology mapping, and root cause analysis. Dynatrace leverages artificial intelligence to identify performance anomalies, predict future performance issues and provide actionable insights for optimization.
Splunk:
Splunk is a data analytics platform that offers APM capabilities through its Splunk Enterprise and Splunk APM solutions. It provides real-time monitoring, log analysis, and machine learning-driven anomaly detection. Splunk’s powerful search and visualization capabilities enable teams to investigate and troubleshoot performance issues across complex application environments quickly.
ServiceNow:
ServiceNow is a cloud-based platform that offers IT service management and APM capabilities. It provides features such as service mapping, event management, and performance analytics, helping teams manage and optimize application performance in the context of IT services. ServiceNow’s APM solution integrates with its IT service management platform, enabling a holistic approach to application performance and service delivery.
AWS:
Amazon Web Services (AWS) offers a range of APM tools as part of its cloud platform. These include Amazon CloudWatch for monitoring and logging, AWS X-Ray for distributed tracing, and Amazon CodeGuru for performance optimization and code reviews. AWS APM tools are tightly integrated with AWS services, making them suitable for applications hosted on the AWS cloud.
Azure:
Microsoft Azure provides APM capabilities through its Azure Monitor platform. It offers application insights, performance diagnostics, and log analytics features. Azure Monitor integrates with Azure services and provides a unified view of application performance across the Azure ecosystem. It also offers built-in alerts and automation capabilities for proactive performance management.
Prometheus:
Prometheus is an open-source monitoring and alerting system widely used for APM. It follows a pull-based approach, scraping metrics from application endpoints and storing them in a time-series database. Prometheus offers a powerful query language, alerting rules, and integration with visualization tools like Grafana, making it a popular choice for cloud-native and Kubernetes-based environments.
Grafana:
Grafana is an open-source data visualization and monitoring platform often used with APM tools like Prometheus. It provides a rich dashboard, charts, and graphs for visualizing application performance data. Grafana supports multiple data sources and offers features such as alerting, annotations, and collaboration, making it a versatile tool for APM.
Elastic:
Elastic offers APM capabilities as part of its Elastic Stack, which includes Elasticsearch, Kibana, and Beats. It provides real-time monitoring, distributed tracing, and log analysis, enabling teams to gain end-to-end visibility into application performance. Elastic APM integrates seamlessly with the Elastic Stack, allowing teams to correlate performance data with log data and perform advanced analytics.
CA APM:
CA APM (now part of Broadcom) is an enterprise-grade APM solution offering end-to-end application performance visibility. It provides features such as real-time monitoring, transaction tracing, and user experience management. CA APM supports various technologies and offers advanced analytics and machine learning capabilities for proactive performance optimization.
SAP:
SAP offers APM capabilities through its SAP AppDynamics solution. It provides real-time monitoring, end-to-end transaction tracing, and code-level diagnostics for SAP and non-SAP applications. SAP AppDynamics integrates with SAP’s business applications and offers business transaction monitoring and user experience management features.
Oracle:
Oracle provides APM capabilities through its Oracle Enterprise Manager platform. It offers real-time monitoring, diagnostics, and analytics for Java and non-Java applications. Oracle Enterprise Manager integrates with Oracle’s technology stack and provides a unified view of application performance across the Oracle ecosystem.
SolarWinds:
SolarWinds offers a range of APM tools, including SolarWinds AppOptics and SolarWinds Server & Application Monitor. These tools provide real-time monitoring, transaction tracing, and infrastructure monitoring capabilities. SolarWinds APM solutions integrate with other SolarWinds products, enabling a comprehensive approach to IT performance management.
IBM:
IBM offers APM capabilities through its IBM Instana solution. It provides automatic discovery and instrumentation, real-time monitoring, and AI-powered analytics for modern application architectures. IBM Instana supports cloud-native and microservices-based applications, offering distributed tracing and service dependency mapping features.
Microsoft:
Microsoft provides APM capabilities through its Azure Monitor platform (mentioned earlier) and also offers Application Insights as part of its Visual Studio development tools. Application Insights provides real-time monitoring, usage analytics, and diagnostics for web applications. It integrates with Azure services and supports various programming languages and frameworks.
Choosing the Right APM Tool
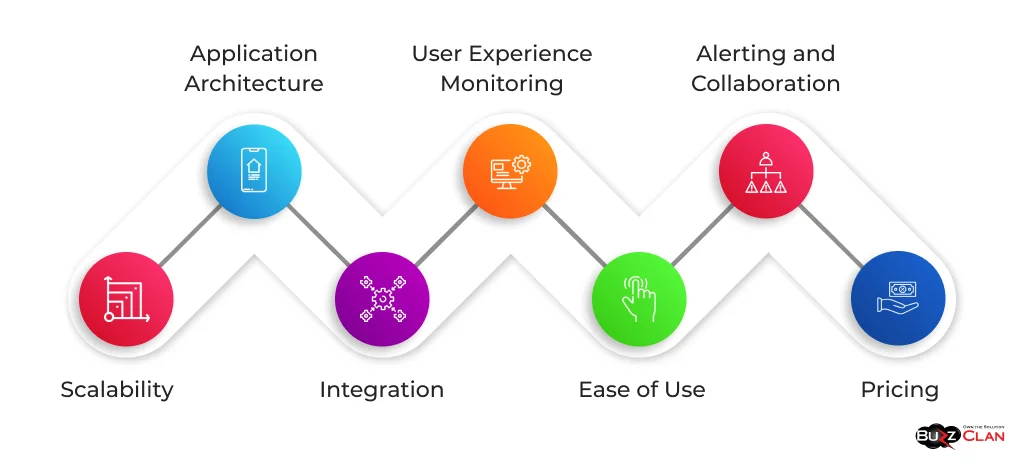
Selecting the right APM tool for your organization depends on several factors. Here are some key criteria to consider when evaluating APM tools:

- Application Architecture: Consider the architecture of your applications, whether they are monolithic, microservices-based, or cloud-native. Ensure the APM tool supports your application’s technology stack and deployment model.
- Scalability: Evaluate the APM tool’s ability to scale with your application’s growth. It should be able to handle a large volume of metrics and provide scalable data storage and processing capabilities.
- Integration: Look for an APM tool that seamlessly integrates with your existing infrastructure, tools, and data sources. It should be able to ingest data from various sources and provide a unified view of application performance.
- User Experience Monitoring: Consider APM tools that offer user experience monitoring capabilities, such as real user monitoring (RUM) and synthetic monitoring. These features provide insights into how end-users interact with your application and help identify performance issues from the user’s perspective.
- Alerting and Collaboration: Evaluate the APM tool’s alerting and collaboration features. It should allow you to set up custom alerts based on specific thresholds and provide integration with incident management and communication tools.
- Ease of Use: Consider the ease of use and learning curve associated with the APM tool. It should provide an intuitive user interface, comprehensive documentation, and support resources.
- Pricing: Assess the APM tool’s pricing model and ensure it aligns with your budget and scaling requirements. Consider factors such as data volume, number of hosts, and additional features when evaluating the cost.
Here’s a comparison table of some popular APM tools based on key criteria:
| APM Tool | Application Architecture | Scalability | Integration | User Experience Monitoring | Alerting and Collaboration | Ease of Use | Pricing Model |
|---|---|---|---|---|---|---|---|
| Datadog | Cloud-native, Microservices | High | Extensive | RUM, Synthetic | Robust | Moderate | Subscription |
| New Relic | Cloud-native, Microservices | High | Extensive | RUM, Synthetic | Robust | Easy | Subscription |
| Dynatrace | Cloud-native, Microservices | High | Extensive | RUM, Synthetic | Robust | Moderate | Subscription |
| Splunk | Monolithic, Microservices | High | Extensive | RUM | Robust | Moderate | License |
| Prometheus | Cloud-native, Microservices | High | Extensive | Limited | Moderate | Moderate | Open Source |
Case Studies and Examples
Let’s explore some real-world case studies of successful Application Performance Monitoring implementations:
Walmart:
Walmart, the world’s largest retailer, leveraged APM to monitor and optimize the performance of its e-commerce platform. By implementing APM, Walmart gained real-time visibility into application performance, identified bottlenecks, and optimized database queries. As a result, they achieved a 20% improvement in page load times, a 98% reduction in critical incidents, and a significant increase in conversion rates.
Netflix:
Netflix, a leading streaming service provider, uses APM to ensure a seamless streaming experience for millions of users worldwide. They developed their own APM tool, Atlas, which collects and analyzes performance metrics from their microservices architecture. By leveraging APM, Netflix proactively identifies and resolves performance issues, ensures high availability, and optimizes content delivery based on user location and device.
Siemens:
Siemens, a global technology company, implemented APM to monitor and optimize the performance of its IoT platform. By using APM, Siemens gained end-to-end visibility into the performance of its connected devices, gateways, and backend systems. They identified and resolved performance bottlenecks, reduced downtime, and improved the overall reliability of their IoT solutions.
These case studies highlight the tangible benefits of APM in improving application performance, user experience, and business outcomes. However, implementing APM also comes with its own set of challenges. Some common challenges include:
| Challenges | Description |
|---|---|
| Complexity | Modern application architectures, such as microservices and cloud-native deployments, can be complex to monitor and troubleshoot. APM tools must provide comprehensive visibility across distributed systems and correlate performance data from multiple sources. |
| Data Volume | As applications generate a large volume of performance data, APM tools need to be able to handle and process this data efficiently. Scalability and data management have become critical factors in APM implementations. |
| Integration | Integrating APM tools with existing infrastructure, tools, and processes can be challenging. It requires careful planning, configuration, and collaboration between development, operations, and IT teams. |
| Skill Requirements | Implementing and using APM tools effectively requires specific skills and knowledge. Organizations must invest in training and upskilling their teams to maximize the benefits of APM solutions. |
Organizations should adopt a phased approach to APM implementation to overcome these challenges, starting with critical applications and gradually expanding to other areas. They should also foster collaboration between development, operations, and business teams to ensure a shared understanding of performance goals and metrics. Additionally, investing in training and building in-house APM expertise can help organizations derive maximum value from their APM investments.
Future Trends in Application Performance Monitoring
As applications evolve and become more complex, the Application Performance Monitoring landscape is also undergoing significant changes. Here are some key trends shaping the future of APM:
AI and Machine Learning:
AI and machine learning are increasingly integrated into APM solutions to enable intelligent performance monitoring and anomaly detection. APM tools leverage machine learning algorithms to analyze vast amounts of performance data, identify patterns, and detect anomalies in real time. AI-powered APM can help organizations proactively identify and resolve performance issues before they impact end-users, reducing downtime and improving overall application reliability.
Integration with DevOps:
APM is becoming integral to the DevOps toolchain, enabling continuous monitoring and feedback throughout the application development lifecycle. APM tools integrate with continuous integration and continuous deployment (CI/CD) pipelines, providing performance insights and quality gates at every stage of the development process. This integration helps organizations shift-left performance testing and ensures that performance issues are identified and resolved early in the development cycle.
Open Source APM:
Open-source APM tools like Prometheus and Grafana are gaining popularity due to their flexibility, scalability, and cost-effectiveness. These tools provide a robust and customizable framework for monitoring application performance, especially in cloud-native and Kubernetes-based environments. They offer a vibrant community, extensive plugin ecosystems, and seamless integration with other open-source technologies, making them a compelling choice for organizations seeking cost-effective and flexible APM solutions.
The Role of APM in Compliance and Security
Application Performance Monitoring ensures compliance with industry regulations and maintains application security. Here’s how APM contributes to compliance and security:
Compliance Requirements:
Many industries have specific compliance requirements for application performance, availability, and data privacy. For example, the healthcare industry must comply with HIPAA regulations, which mandate patient data protection and critical healthcare systems’ availability. APM tools help organizations monitor and demonstrate compliance by providing detailed performance metrics, logs, and audit trails. APM data can be used to generate compliance reports, identify potential violations, and take corrective actions.
Security Monitoring:
APM tools can also help detect and prevent security breaches by monitoring application behavior and identifying anomalies. APM solutions can track user activities, detect unusual patterns, and alert security teams of potential incidents. By monitoring application performance and user interactions in real-time, APM tools can help identify and mitigate security risks such as unauthorized access attempts, data exfiltration, and application-layer attacks. Integration with security information and event management (SIEM) systems further enhances the security capabilities of APM, enabling a holistic view of application performance and security.
Conclusion
Throughout this blog post, we have explored the key concepts of APM, including its definition, key components, and types. We have also discussed popular APM tools in the market, the criteria for selecting the right tool, and real-world case studies showcasing the benefits of APM. Additionally, we have highlighted the future trends shaping the APM landscape, such as the integration of AI and machine learning, the convergence with DevOps practices, and the rise of open-source APM solutions.
As applications continue to grow in complexity and criticality, the role of APM in ensuring compliance and security has also become more prominent. APM tools help organizations meet industry regulations, detect security breaches, and maintain confidentiality, integrity, and availability of application data.
Organizations must adopt a strategic approach that aligns with their business goals, application architecture, and technology stack to succeed with APM. They should carefully evaluate APM tools based on their specific requirements, scalability needs, and integration capabilities. Building a skilled APM team, establishing performance baselines, and continuously monitoring and optimizing application performance are key steps in realizing APM’s full potential.
FAQs

Get In Touch
Follow Us
Table of Contents
- Introduction
- What is Application Performance Monitoring?
- Key Components of Application Performance Monitoring
- Types of Application Performance Monitoring
- Popular Application Performance Monitoring Tools
- Choosing the Right APM Tool
- Case Studies and Examples
- Future Trends in Application Performance Monitoring
- The Role of APM in Compliance and Security
- Conclusion
- FAQs


