A Guide to Observability Engineering for Modern Software Teams
Devesh Rawat
Mar 14, 2024
Introduction to Observability Engineering
Observability Engineering refers to designing and implementing the necessary infrastructure, tools, and processes to monitor software systems and gain enhanced visibility into their internal state and behavior.
As modern software applications grow in complexity, spanning distributed microservices and serverless components across cloud environments, traditional approaches to troubleshooting issues reactively using log traces prove inadequate.
Observability engineering establishes resilient telemetry pipelines ubiquitously across stacks to surface signals needed to uphold health proactively - enabling smarter incident response through correlated alerts, noise reduction, and eventually automatic remediations that uphold site reliability objectives.
Responsibilities of an Observability Engineer
- Design and implement observability infrastructure across cloud-native stacks by instrumenting applications at the code level and infrastructure/middleware layers and integrating useful event data pipelines.
- Analyzing and transforming monitoring signals into actionable insights using analytics dashboards, intelligent alerting configurations, and data visualization.
- Enabling traceability end-to-end correlating events across servers, containers, functions, CDNs, and origin sources for transaction journeys.
- Improving the mean time to detection and recovery for issues through applied intelligence - anomaly detection, log clustering, noise reduction, and report generation.
- Collaborate with development and SRE teams on software engineering best practices, upholding stability, conducting post-mortems, and driving resilience hygiene.
Key skills for observability engineers encompass
- Fluency instrumenting across logs, metrics, tracing using OpenTelemetry, Prometheus, Grafana, and understanding data ingestion tradeoffs
- Infrastructure as code skills using Ansible, Terraform, and Kubernetes declarative specifications
- Data warehousing and analytics excellence leveraging Snowflake, Big Query, AWS Glue and Sagemaker
- Security mindset securing data flows end-to-end through encryption, access controls, and compliance governance
- API savviness and SDLC integration proficiency upholding CI/CD DevOps cultural norms and toolchains
Observability and Software Engineering Objectives
Implementing observability as an integral part of the software development process, rather than an afterthought, is crucial for ensuring software systems' long-term reliability and security. This tight integration allows issues to be identified and resolved early on, preventing them from propagating downstream and causing significant problems later.
Benefits of Shifting Observability Left

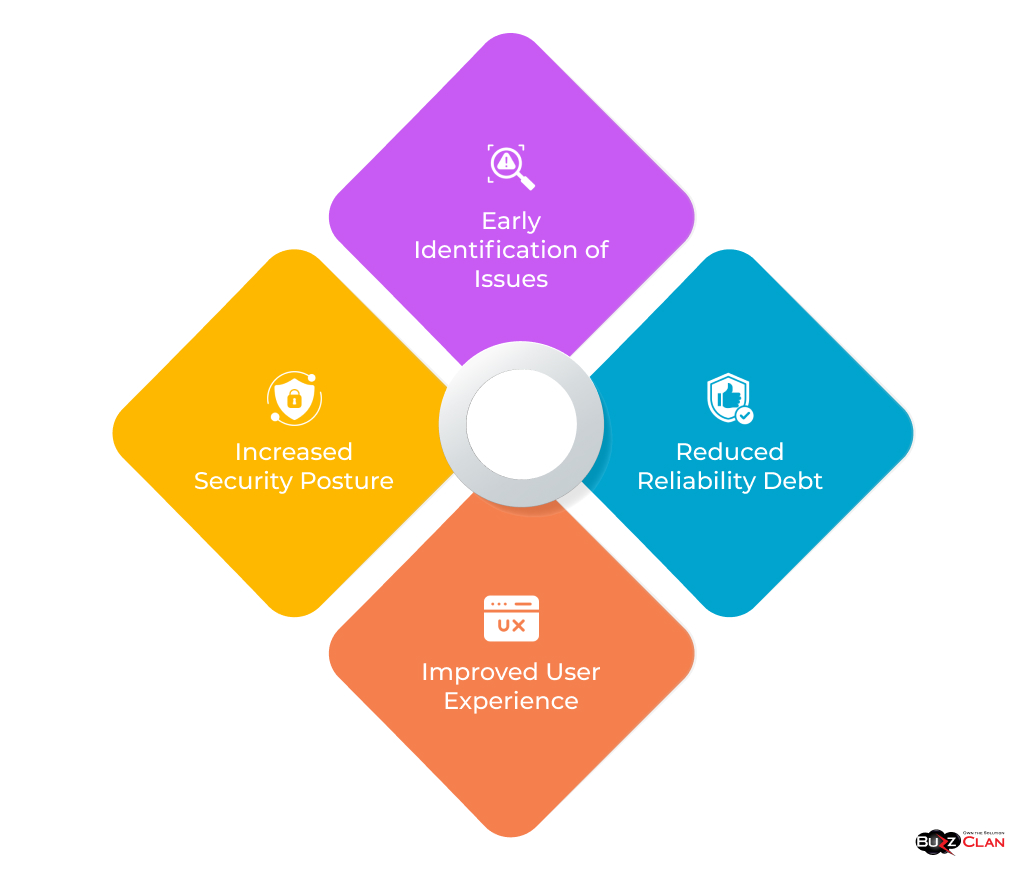
- Early Identification of Issues: By integrating observability into the development process, issues can be identified and resolved early on before they can cause significant damage.
- Reduced Reliability Debt: By addressing issues early, organizations can avoid accumulating reliability debt, which can lead to long-term problems and increased costs.
- Improved User Experience: By identifying and resolving issues early, organizations can improve the user experience by ensuring their systems are reliable and performant.
- Increased Security Posture: By integrating observability into the development process, organizations can improve security posture by identifying and mitigating vulnerabilities early on.
Pervasive instrumentation is a critical aspect of effective observability in modern distributed systems. It involves instrumenting code at various levels of an application, including client-side, server-side, and infrastructure components, to collect valuable telemetry data. This data provides deep insights into the system's behavior, performance, and health, enabling organizations to identify and resolve issues proactively.
OpenTelemetry is a vendor-neutral observability framework that has emerged as the de facto standard for pervasive instrumentation. It offers a unified approach to collecting telemetry data from diverse sources, such as applications, libraries, and infrastructure components, and then exporting it to various back-end systems for storage and analysis.
Here are some key benefits of pervasive instrumentation with OpenTelemetry
- Unified Data Collection: OpenTelemetry provides a consistent and standardized way to collect telemetry data, regardless of the programming language, framework, or platform. This simplifies the process of instrumenting code and ensures interoperability between different components.
- Vendor Neutrality: OpenTelemetry is not tied to any specific vendor or platform. This allows organizations to choose the best-of-breed tools and services for their observability needs without being locked into a particular vendor ecosystem.
- Extensibility: OpenTelemetry is highly extensible, allowing organizations to add custom instrumentation to capture specific metrics, logs, and traces relevant to their unique business needs.
- Open Source: OpenTelemetry is an open-source project supported by a vibrant community of contributors. This ensures continuous development, regular updates, and a wide range of resources and support.
- Community Support: The OpenTelemetry community is active and supportive, providing documentation, tutorials, examples, and best practices to help users get started with pervasive instrumentation and troubleshoot any issues they may encounter.
By embracing pervasive instrumentation with OpenTelemetry, organizations can unlock the full potential of observability and gain a comprehensive understanding of their systems, leading to improved performance, reliability, and user experience.
Security Groups' Access Policies
Security groups are fundamental to cloud security. Organizations can implement declarative access policies for security groups to ensure that only authorized users can access sensitive resources. This helps prevent unauthorized access and data breaches.
Observability Toolchain Integration
Integrating observability tools into the software development toolchain is critical to modern software development. It ensures that observability is integral to the development process, enabling developers to identify and resolve issues proactively.
Native integration of validation checks for logs, metrics, and traces into the development toolchain offers several key benefits:
- Early detection of misconfigurations: Validation checks can identify misconfigurations in observability settings early in the development process, preventing them from propagating to production environments.
- Consistent data collection and analysis: Native integration ensures that observability data is collected and analyzed consistently across different environments, providing a unified view of the system's behavior.
- Improved developer productivity: Developers can focus on building and maintaining their applications without worrying about the intricacies of observability tool configuration and data management.
Here are some specific examples of how observability toolchain integration can be implemented:
- Static code analysis tools can be used to check for potential observability issues in the code, such as missing or misconfigured logging statements.
- Unit and integration tests can include checks to ensure that observability data is collected and emitted correctly.
- Continuous integration/continuous delivery (CI/CD) pipelines can include stages that validate observability configurations and collect and analyze observability data.
- Observability platforms can provide native integrations with popular development tools and frameworks, making it easy for developers to add observability to their applications.
By integrating observability tools into the development toolchain, organizations can ensure that observability is a first-class citizen in the software development process. This leads to improved software quality, reduced downtime, and faster issue resolution.
In addition to the benefits mentioned above, observability toolchain integration can also help to:
- Improve the customer experience: By providing real-time insights into application performance and behavior, observability can help organizations identify and resolve issues that impact customers.
- Reduce costs: Observability can help organizations avoid costly downtime and lost productivity by proactively identifying and resolving issues.
- Increase agility: By providing a deep understanding of the system's behavior, observability can help organizations make informed decisions about improving their applications and infrastructure.
Observability Engineering Jobs and Career Path
Market Trajectory for Observability Talent
As systems complexity grows with cloud-native adoption spanning containers, microservices, and distributed serverless architectures across geo-diverse deployment domains, the need emerges for expert talent to tame chaos and systematically uphold resilience and continuity through holistic Observation management, sustenance, and value creation conversions.
Per LinkedIn projections, Observability Engineer openings are expected to triple in the next few years, given the proliferation of software capabilities that demand business-critical IT reliability. Domain skills prove foundational in guiding career growth progression.
Compensation for Observability Roles
According to Glassdoor, average Observability engineering salaries in the US span between $130,000 to $160,000 for mid-level roles - varying based on technologies like Kubernetes administration, AWS/GCP Cloud expertise, programming languages proficiency around Go, Java, Python, etc, and specificity of debugging complexities tackled so far like scaling Elasticsearch log warehousing or crafting Grafana analytics dashboards.
Tools and Technologies for Observability
Instrumentation Tools

Open standards projects like OpenTelemetry (CNCF) and OpenMetrics have revolutionized instrumentation by enabling uniform collection and exporting of telemetry data into backend data stores through auto-instrumentation. These projects break free from vendor-specific agent lock-ins, offering flexibility options and striking a balance between cost and depth tradeoffs judiciously for tailored needs.
Leading commercial instrumentation tools like Dynatrace, NewRelic, Splunk, and Datadog provide additional capabilities beyond open standards. However, open-source techniques can suffice for observability fundamentals, especially when carefully curated combinations like Prometheus, Loki, Tempo traces, etc., are employed.
Analytics and Visualization

Open-source Grafana has emerged as an industry visualization standard for robust real-time and historical telemetry analytics exploration. Its strength lies in simple yet powerful data source abstractions spanning time series logs, allowing unified and consolidated glass panels. Log scale needs are well-addressed by the Elastic Stack and Datadog. Advancements in ML-driven APM (application performance monitoring) assist in noise reduction, directing attention smartly to areas that matter most.
By leveraging these open standards and tools, organizations can achieve comprehensive observability across their systems, gain deep insights into application performance, and make data-driven decisions to optimize their operations.
Observability and Chaos Engineering
Observability involves systematically designing visibility into systems by instrumenting them deeply. In contrast, chaos engineering takes learnings exposed on the flip side by deliberately injecting failures outward into running environments. This approach replicates realistic conditions safely to bolster confidence and uphold mission-critical system integrity and continuity standards without impacting customers.
Chaos engineering tools, such as Netflix's open-source Simian Army suite, empower organizations to intentionally introduce controlled disruptions to their systems and infrastructure safely and reliably. These tools enable engineers to experiment with various failure scenarios, identify potential vulnerabilities, and build more resilient systems.
Key features of chaos engineering tools include

- Experimentation platform: Provides a centralized platform to design, execute, and monitor chaos experiments.
- Blast radius control: Allows engineers to limit the scope and impact of experiments, ensuring that disruptions are contained and do not affect critical systems.
- Automated rollbacks: If an experiment causes unexpected issues, it automatically reverts changes and restores the system to its original state.
- Real-time monitoring: Continuously monitors system metrics and performance during experiments to detect and mitigate adverse effects.
Chaos Engineering
Chaos engineering is a proactive and systematic approach to building more robust and resilient systems. By embracing chaos engineering tools and practices, organizations can gain a competitive advantage in the digital age.
Chaos engineering tools facilitate the transparent unleashing of infrastructure disruption experiments while adhering to safeguards and best practices. They promote a learning and continuous improvement culture as engineers gain valuable insights from experiment results. These insights help identify weaknesses, create actionable remediation roadmaps, and enhance enterprise systems' reliability and resilience.
By leveraging chaos engineering tools, organizations can:
- Improve system resilience: Identify and address potential vulnerabilities before they cause outages or disruptions in production environments.
- Reduce downtime: Minimize the duration and impact of outages by rapidly detecting and recovering from failures.
- Accelerate innovation: Experiment with new technologies and architectures without fear of causing major disruptions.
- Enhance customer experience: Deliver reliable and consistent services to end-users by minimizing downtime and performance issues.
The combined partnership of observability and chaos engineering significantly enhances resilience beyond what is achievable individually. Metrics gathered during experiments provide baselines for determining normalcy boundaries. Violations are automatically corrected or intelligently alerted when anomalous behaviors are detected, predicting risks like capacity planning headroom shortfalls or region-specific dependencies that warrant decoupling.
By combining observability and chaos engineering, organizations can achieve the following benefits:
- Improved system reliability and availability
- Reduced risk of outages and unplanned downtime
- Faster detection and resolution of incidents
- Increased confidence in the ability of systems to handle unexpected failures
- Improved capacity planning and resource allocation
- Enhanced customer experience and satisfaction
Certifications in Observability
Certifications are crucial in validating an individual's capabilities, experience, and work ethic in a specific field. Obtaining certifications demonstrates mastery beyond conceptual knowledge in observability technologies like Elasticsearch, Kafka, and Kibana.
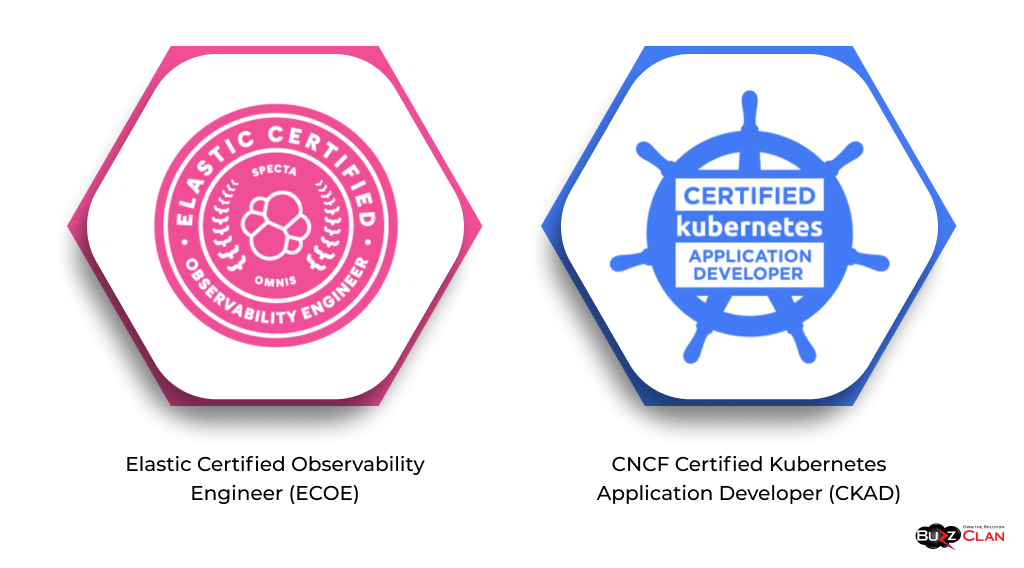
Two widely recognized certifications in this domain are:

- Elastic Certified Observability Engineer (ECOE): This certification assesses the candidate's expertise in the ELK Stack—Elasticsearch, Beats, Logstash, and Kibana—and their ability to operationalize these technologies effectively.
- CNCF Certified Kubernetes Application Developer (CKAD): This certification focuses on designing observable application architectures leveraging continuous integration and continuous delivery (CI/CD) practices. It also evaluates the candidate's proficiency in troubleshooting issues using metrics and logs under load while showcasing their proficiency with CNCF tools.
Alternative certifications from vendors such as Datadog and Splunk provide vendor-specific credibility and signal specialized skills that align with specific job requirements. However, it's important to note that holistic instrumentation, data extraction, warehousing, analytics, and actioning skills are transferable across different technologies, enabling practitioners to make pragmatic trade-offs in their processing choices.
Beyond certifications, continuous learning and hands-on experience are essential for staying current in this rapidly evolving field. Practitioners can further enhance their capabilities and validate their expertise by actively seeking opportunities to contribute to open-source projects, participate in online communities, and engage in real-world projects.
Data Engineering and Observability
Data platforms are pivotal in building robust observability pipelines, warranting careful consideration and planning. These platforms provide the necessary infrastructure and services to collect, store, process, and analyze large volumes of data from various sources across an organization.
Let's delve deeper into the three key aspects of data platforms that contribute to their effectiveness as the backbone of observability pipelines.
Centralization:
Data warehouses like Snowflake or BigQuery are central repositories for data collected from disparate sources. They offer several advantages, including:
- Durable Persistence: Data warehouses provide reliable and long-term storage, ensuring that data is preserved and accessible for future analysis and decision-making.
- Data Transformation: They facilitate efficient data transformation, allowing organizations to clean, enrich, and harmonize data from different sources, improving its quality and usability.
- Access Efficiency: Data warehouses enable efficient and secure access to data for various stakeholders, including analysts, data scientists, and business users, fostering collaboration and data-driven decision-making.
- Consolidation: By consolidating data from multiple sources, data warehouses overcome the risk of data silos and provide a unified and comprehensive view of the organization's operations and performance.
Performance:
Specialized time-series databases like InfluxDB are designed to handle high-volume, time-series data generated by IoT devices, sensors, and other monitoring systems. Key features of these databases include:
- Columnar Storage: Columnar storage allows faster data retrieval by storing data in columns rather than rows, reducing latency and improving scalability.
- High Cardinality Writes: Time series databases are optimized for high-cardinality writes, meaning they can efficiently handle data with many unique values commonly encountered in IoT and monitoring scenarios.
- Purpose-Built Analytics: They offer built-in analytics functions and optimizations tailored for time-series data, enabling efficient analysis and visualization of trending patterns and anomalies.
- Retention Policies: These databases provide granular control over data retention policies, allowing organizations to define custom retention periods for different data types, striking a balance between storage costs and the need for historical data.
Protection:
Protecting analytics assets is of utmost importance, especially in the face of increasing data risks. Data platforms offer several security measures to safeguard sensitive information:
- Encryption: Data encryption ensures that data is protected at rest and in transit, minimizing the risk of unauthorized access in case of security breaches.
- Data Obfuscation: Sensitive data can be obfuscated or anonymized to protect personally identifiable information (PII) and comply with privacy regulations.
- Access Controls: Stringent access controls, including role-based access control (RBAC) and multi-factor authentication (MFA), restrict access to data based on user roles and permissions.
- Governance Support: Data platforms provide features to support governance initiatives, such as data lineage tracking, labeling, and audit trails, enabling organizations to meet compliance requirements and maintain data integrity.
By carefully considering these aspects of data platforms, organizations can build robust and scalable observability pipelines that empower data-driven decision-making, optimize operations, and drive business success.
Conclusion
Observability Engineering instills systematic resilience across software capabilities by comprehensively monitoring, analyzing, and troubleshooting complex systems. Here are some aspects of Observability Engineering that resonate with the challenges faced by organizations:
Domain Knowledge Mastery:
- Mastering domain knowledge is crucial for understanding the behavior of complex systems and identifying potential issues.
- It enables engineers to develop effective monitoring strategies and derive meaningful insights from telemetry data.
- Continuous learning and staying updated with the latest technologies and best practices are key to maintaining domain expertise.
Advanced Instrumentation:
- Advanced instrumentation involves deploying sensors and probes strategically throughout the system to collect telemetry data.
- It provides visibility into the system's internal workings and allows for real-time monitoring of key metrics and performance indicators.
- Best practices include using various instrumentation techniques, such as logging, metrics, and distributed tracing, to capture a comprehensive system view.
Actionability from Telemetry Signals:
- Deriving actionability from telemetry signals is essential for turning raw data into actionable insights that can improve system performance and reliability.
- This involves analyzing telemetry data, identifying anomalies and patterns, and correlating data from different sources to better understand the system.
- Automated alerts and notifications ensure critical issues are detected and addressed promptly.
Taming Complexity:
- Observability Engineering helps tame the complexity of exponentially complex systems by providing a unified view of the entire system and its components.
- It enables engineers to identify bottlenecks, performance issues, and dependencies and to make informed decisions about system design and optimization.
- By leveraging advanced tools and techniques, organizations can gain deeper insights into their systems and improve overall stability and performance.
Customer Experience:
- Upholding customer experiences uniformly meeting modern velocity and quality standards is critical for business success.
- Observability Engineering enables organizations to monitor and track customer-facing metrics, such as latency, availability, and error rates, and identify and resolve issues impacting customer satisfaction.
- Organizations can build customer trust and loyalty by ensuring a consistent and high-quality customer experience.
FAQs

Get In Touch
